The 10 keys to an effective metrics dashboard
In Online Marketing Today, it is essential to have a dashboard of metrics to track results. Good marketing teams know how to select the most important KPIs to make sure they have the information they need, but they don’t always pay the same attention to how they present them.
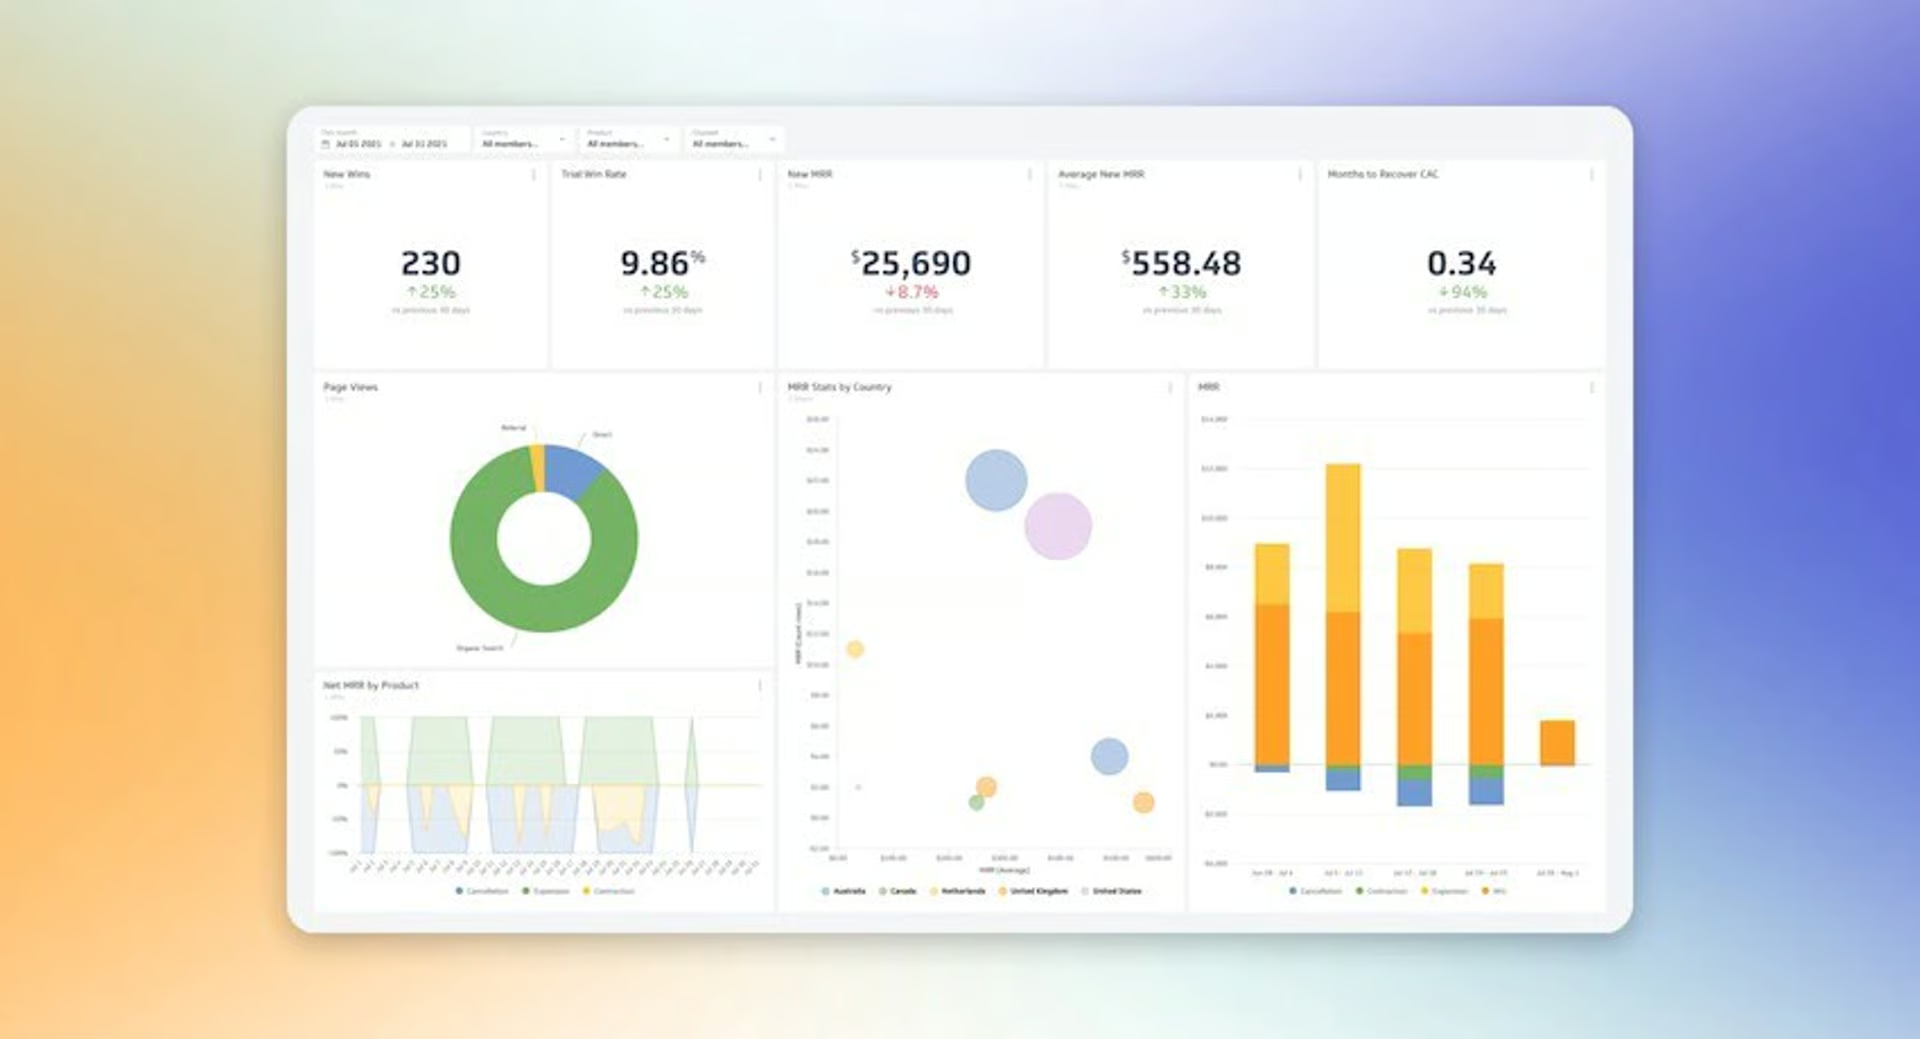
The dashboard is the “dashboard” of your marketing campaigns, the place where key decisions about the future of the company are made. If it’s well presented and organized, you’ll be much more efficient. Therefore, we are going to see what the 10 keys to an effective metrics dashboard are.
Top 10 Practices for Building Effective Dashboards
1) Know your audience
The best dashboard is the one that best suits your recipients. You have to understand that within the same company, there can be audiences with very different needs: from the sales manager who wants to know what is happening in 30 seconds, to the marketing team who spends hours analyzing the metrics, to the boss who needs to make sure that the investment is justified.
So first of all, consider who the metrics are aimed at, what they need to know, and what their level of knowledge is on the subject. You may find it necessary to create a different dashboard for each audience, or even several. But the important thing is that each of them has the right data and level of complexity to report without being overpowered.
2) Consider the size of the screens
It is not the same to review a metrics dashboard from a desktop computer with a dual screen as from a mobile phone. And the reality is that in today’s companies, there are both options and all the intermediate ones.
How can you solve this problem? Always keeping in mind that the design is responsive and appropriate to different user experiences, since it is not the same to filter the data by having a keyboard and mouse as by touching a screen. If in doubt, consult a UX expert who can guide you on your specific case.
3) Optimizes charging times
The best metrics dashboard in the world is useless if users get desperate before it finishes loading.
One of the most frequent problems in these cases is the filters. If you have a lot of data, it may take time for the system to find and display the information you’re looking for. In general, keep in mind that “Show Only” filters tend to be faster to load than “Exclude” filters. And when in doubt, don’t be afraid to simplify the interface or graphics if that helps them load better.
4) Take advantage of hot spots
For your dashboard to be truly effective, you need to understand users‘ reading patterns on the internet. As a rule, you start viewing content from the top left of the screen, which concentrates most of your attention. The rest of the content is quickly scanned for relevant information.
Moral: Once you are clear about the main message of your metrics, place that data in the top left to ensure that it jumps out at you.
5) Limit the number of panels and colors
The maxim “less is more” applies perfectly to metrics dashboards. Sure, you have a lot of data that seems relevant to you, but adding it all will create confusion and dilute the main message. Ideally, you should limit yourself to two or three panels.
In the same way, excess colors can make it more difficult to visualize information. The simpler and “cleaner” your graphics are, the better.
6) Add interactive elements
The great power of dashboards lies in the ability to display multiple variables at once and be able to compare them against each other using different filters (e.g., highlighting data from users in a certain demographic or who live in a certain location). You can also incorporate search boxes so that users can search for a specific piece of information.
7) Take care of the design
To provide a pleasant user experience, the different design elements should be consistent across the dashboard. To make this happen, try to plan the design by going from the most general to the most specific, that is, from the template to each of the graphics. In particular, it is advisable not to mix fonts or color ranges.
8) Take advantage of pop-up texts
Pop-up texts or “tooltips” (a kind of “help balloons” that appear when you hover the mouse over a specific piece of information) are very useful to help you tell what is happening.
Spend a little time optimizing this aspect so that they display relevant information for the user, in a format that is easy to understand at first glance and with consistent wording, whatever the number shown (e.g., be careful with plurals and singulars).
9) Do a general cleaning before you finish
We’ve already seen that “less is more,” but it’s worth repeating. Before you publish your dashboard, take an overview of it and try to put yourself in the perspective of someone viewing it for the first time. All elements have to serve a specific function. If there’s a metric, tag, title, or legend that doesn’t add value, you’re out! And remember that white space is very important to ensure readability.
10) Test
You’re almost ready to publish your dashboard; you’re just missing the last revision. Preview and click on the different filters and options to make sure everything looks perfect and that nothing is missing or left over. In particular, pay attention to making the titles consistent with each other and ensuring that the graphics look good on different devices. Ready!